Malheur County, Oregon | |
|---|---|
 Malheur County Courthouse in Vale | |
 Location within the U.S. state of Oregon | |
| Coordinates: 43°13′N 117°38′W / 43.21°N 117.63°W | |
| Country | |
| State | |
| Founded | February 17, 1887 |
| Named after | Malheur River |
| Seat | Vale |
| Largest city | Ontario |
| Government | |
| • County Judge | Dan Joyce |
| Area | |
• Total | 9,930 sq mi (25,700 km2) |
| • Land | 9,888 sq mi (25,610 km2) |
| • Water | 42 sq mi (110 km2) 0.4% |
| Population (2020) | |
• Total | 31,571 |
• Estimate (2024) | 32,315 |
| • Density | 3.193/sq mi (1.233/km2) |
| Time zones | |
| primary | UTC−7 (Mountain) |
| • Summer (DST) | UTC−6 (MDT) |
| southern fifth | UTC−8 (Pacific) |
| • Summer (DST) | UTC−7 (PDT) |
| Congressional district | 2nd |
| Website | www.malheurco.org |
Malheur County (/mælˈhɪər/ ⓘ, French pronunciation: [ma.lœʁ]) is one of the 36 counties in the U.S. state of Oregon. As of the 2020 census, the population was 31,571.[1] Its county seat is Vale,[2] and its largest city is Ontario. The county was named after the Malheur River, which runs through the county. The word "malheur" is French for misfortune or tragedy.[3] Malheur County is included in the Ontario, Oregon Micropolitan Statistical Area, which is also included in the Boise Combined Statistical Area. It is included in the eight-county definition of Eastern Oregon.
History
[edit]Malheur County was created February 17, 1887, from the southern territory of Baker County. It was first settled by miners and stockmen in the early 1860s. The discovery of gold in 1863 attracted further development, including settlements and ranches. Basques settled in the region in the 1890s and were mainly engaged in sheep raising.[4]
Geography
[edit]According to the United States Census Bureau, the county has a total area of 9,930 square miles (25,700 km2), of which 9,888 square miles (25,610 km2) is land and 42 square miles (110 km2), comprising 0.4%, is water.[5] It is the second-largest county in Oregon by area and the only county in Oregon in the Mountain Time Zone.
 Pillars of Rome, from US 95 near Rome
Adjacent counties
[edit]- Grant County - northwest/Pacific Time Border
- Baker County - north/Pacific Time Border
- Washington County, Idaho - northeast
- Payette County, Idaho - east
- Canyon County, Idaho - east
- Owyhee County, Idaho - east
- Humboldt County, Nevada - south
- Harney County - west/Pacific Time Border
National protected areas
[edit]- Deer Flat National Wildlife Refuge (part)
- Malheur National Forest (part)
- Whitman National Forest (part)
Highways
[edit]Railroads
[edit]The main railroad in Malheur County is the Oregon Eastern Railroad. This line goes from Ontario to the Celatom Plant in Vale.[6][7] This railroad is all that remains of the Wyoming Colorado Railroad, a short line between Colorado, Wyoming and Oregon.
 OERR locomotive at Vale
Time zones
[edit] Map of Malheur County
  Most of Malheur County (shown in purple) is in the Mountain Time Zone; a small portion in the southern part of the county is in the Pacific Time Zone along with the rest of the state of Oregon and neighboring Nevada.
As with many cities, Malheur County's cities had functioned with both city time and railroad time. This changed by order of the Interstate Commerce Commission on May, 13th 1923 with cities adopting train time.[8][9] Malheur County is still one of the few counties in the United States with two time zones. Most of the county is in the Mountain Time Zone, but a small portion in the south is in the Pacific Time Zone, indicative of that area's proximity to its main service town, Winnemucca, Nevada.
Demographics
[edit]| Census | Pop. | Note | %± |
|---|---|---|---|
| 1890 | 2,601 | — | |
| 1900 | 4,203 | 61.6% | |
| 1910 | 8,601 | 104.6% | |
| 1920 | 10,907 | 26.8% | |
| 1930 | 11,269 | 3.3% | |
| 1940 | 19,767 | 75.4% | |
| 1950 | 23,223 | 17.5% | |
| 1960 | 22,764 | −2.0% | |
| 1970 | 23,169 | 1.8% | |
| 1980 | 26,896 | 16.1% | |
| 1990 | 26,038 | −3.2% | |
| 2000 | 31,615 | 21.4% | |
| 2010 | 31,313 | −1.0% | |
| 2020 | 31,571 | 0.8% | |
| 2024 (est.) | 32,315 | [10] | 2.4% |
| U.S. Decennial Census[11] 1790–1960[12] 1900–1990[13] 1990–2000[14] 2010–2020[1] | |||
2020 census
[edit]| Race / Ethnicity (NH = Non-Hispanic) | Pop 1980[15] | Pop 1990[16] | Pop 2000[17] | Pop 2010[18] | Pop 2020[19] | % 1980 | % 1990 | % 2000 | % 2010 | % 2020 |
|---|---|---|---|---|---|---|---|---|---|---|
| White alone (NH) | 21,933 | 19,839 | 21,752 | 19,906 | 18,975 | 81.55% | 76.19% | 68.80% | 63.57% | 60.10% |
| Black or African American alone (NH) | 75 | 63 | 369 | 331 | 447 | 0.28% | 0.24% | 1.17% | 1.06% | 1.42% |
| Native American or Alaska Native alone (NH) | 134 | 177 | 273 | 235 | 295 | 0.50% | 0.68% | 0.86% | 0.75% | 0.93% |
| Asian alone (NH) | 824 | 783 | 608 | 511 | 385 | 3.06% | 3.01% | 1.92% | 1.63% | 1.22% |
| Native Hawaiian or Pacific Islander alone (NH) | x [20] | x [21] | 18 | 12 | 40 | x | x | 0.06% | 0.04% | 0.13% |
| Other race alone (NH) | 129 | 21 | 37 | 21 | 115 | 0.48% | 0.08% | 0.12% | 0.07% | 0.36% |
| Mixed race or Multiracial (NH) | x [22] | x [23] | 459 | 430 | 994 | x | x | 1.45% | 1.37% | 3.15% |
| Hispanic or Latino (any race) | 3,801 | 5,155 | 8,099 | 9,867 | 10,320 | 14.13% | 19.80% | 25.62% | 31.51% | 32.69% |
| Total | 26,896 | 26,038 | 31,615 | 31,313 | 31,571 | 100.00% | 100.00% | 100.00% | 100.00% | 100.00% |
As of the 2020 census, the county had a population of 31,571. Of the residents, 24.5% were under the age of 18 and 17.7% were 65 years of age or older; the median age was 38.0 years. For every 100 females there were 119.1 males, and for every 100 females age 18 and over there were 124.6 males. 41.1% of residents lived in urban areas and 58.9% lived in rural areas.[24][25][26]
The racial makeup of the county was 68.5% White, 1.5% Black or African American, 1.7% American Indian and Alaska Native, 1.3% Asian, 0.2% Native Hawaiian and Pacific Islander, 16.6% from some other race, and 10.3% from two or more races. Hispanic or Latino residents of any race comprised 32.7% of the population.[26]
There were 10,505 households in the county, of which 33.3% had children under the age of 18 living with them and 25.4% had a female householder with no spouse or partner present. About 26.8% of all households were made up of individuals and 13.2% had someone living alone who was 65 years of age or older.[25]
There were 11,615 housing units, of which 9.6% were vacant. Among occupied housing units, 61.2% were owner-occupied and 38.8% were renter-occupied. The homeowner vacancy rate was 1.5% and the rental vacancy rate was 5.7%.[25]
2010 census
[edit]As of the 2010 census, there were 31,313 people, 10,411 households, and 7,149 families living in the county.[27] The population density was 3.2 inhabitants per square mile (1.2/km2). There were 11,692 housing units at an average density of 1.2 units per square mile (0.46 units/km2).[28] The racial makeup of the county was 77.5% white, 1.7% Asian, 1.2% American Indian, 1.2% black or African American, 0.1% Pacific islander, 15.5% from other races, and 2.9% from two or more races. Those of Hispanic or Latino origin made up 31.5% of the population.[27] In terms of ancestry, 16.2% were German, 11.9% were English, 10.3% were Irish, and 9.9% were American.[29]
Of the 10,411 households, 34.8% had children under the age of 18 living with them, 51.6% were married couples living together, 11.8% had a female householder with no husband present, 31.3% were non-families, and 26.0% of all households were made up of individuals. The average household size was 2.69 and the average family size was 3.24. The median age was 36.2 years.[27]
The median income for a household in the county was $39,144 and the median income for a family was $46,136. Males had a median income of $33,234 versus $27,883 for females. The per capita income for the county was $16,335. About 15.2% of families and 22.7% of the population were below the poverty line, including 27.1% of those under age 18 and 10.5% of those age 65 or over.[30]
2000 census
[edit]As of the 2000 census, there were 31,615 people, 10,221 households, and 7,348 families living in the county. The population density was 3 people per square mile (1.2 people/km2). There were 11,233 housing units at an average density of 1 units per square mile (0.39/km2). The racial makeup of the county was:
- 75.78% White
- 1.22% Black or African American
- 1.02% Native American
- 1.96% Asian
- 0.08% Pacific Islander
- 17.38% from other races
- 2.56% from two or more races
25.62% of the population were Hispanic or Latino of any race. 14.2% were of German, 10.5% English, 8.4% American and 6.9% Irish ancestry. 79.4% spoke English and 19.4% spoke Spanish as their first language.
There were 10,221 households, out of which 36.20% had children under the age of 18 living with them, 57.30% were married couples living together, 10.40% had a female householder with no husband present, and 28.10% were non-families. 23.70% of all households were made up of individuals, and 12.00% had someone living alone who was 65 years of age or older. The average household size was 2.77 and the average family size was 3.28.
In the county, the population was spread out, with 27.60% under the age of 18, 10.60% from 18 to 24, 27.20% from 25 to 44, 21.00% from 45 to 64, and 13.70% who were 65 years of age or older. The median age was 34 years. For every 100 females, there were 116.00 males. For every 100 females age 18 and over, there were 121.20 males.
The median income for a household in the county was $30,241, and the median income for a family was $35,672. Males had a median income of $25,489 versus $21,764 for females. The per capita income for the county was $13,895. About 14.60% of families and 18.60% of the population were below the poverty line, including 25.80% of those under age 18 and 11.60% of those age 65 or over.
Malheur County is the poorest county in Oregon.[31] As of 2008, 21% of its residents live in poverty.[32]
Politics
[edit].gif) [33]
[33]
Like most counties in eastern Oregon, the majority of registered voters who are part of a political party in Malheur County are members of the Republican Party. In the 2008 presidential election, 69.10% of Malheur County voters voted for Republican John McCain, while 28.47% voted for Democrat Barack Obama and 2.42% of voters voted for a third-party candidate. These statistics do not include write-in votes.[34] These numbers show a small shift towards the Democratic candidate when compared to the 2004 presidential election, in which 74.9% of Malheur Country voters voted for George W. Bush, while 23.8% voted for John Kerry, and 1.3% of voters either voted for a third-party candidate or wrote in a candidate.[35]
Malheur County is one of the dominant Republican counties in Oregon when it comes to presidential elections. It was one of only two counties in Oregon to give the majority of its vote to Barry Goldwater and has favored the Republican candidate for decades.[36] The last Democratic candidate to carry the county was Franklin D. Roosevelt in 1940, and only by a margin of 29 votes.[37] Further every Republican candidate since 1996 has received more than 60% of the county's vote.[38] Malheur County is also one of the most reliably Republican counties in state elections, for example in the 1998 gubernatorial election it was the only county to vote for Bill Sizemore instead of John Kitzhaber, and in the 1998 U.S. Senate election, it was the only county to vote for state senator John Lim over Ron Wyden.
As part of Oregon's 2nd congressional district it has been represented by Republican Cliff Bentz since 2021. In the Oregon Legislature, Malheur County is within Oregon's 30th Senate district, represented by Republican Lynn Findley. It's also within the 60th District in the Oregon House, which is represented by Republican Mark Owens.
| Year | Republican | Democratic | Third party(ies) | |||
|---|---|---|---|---|---|---|
| No. | % | No. | % | No. | % | |
| 1904 | 799 | 63.82% | 280 | 22.36% | 173 | 13.82% |
| 1908 | 800 | 54.42% | 543 | 36.94% | 127 | 8.64% |
| 1912 | 648 | 33.77% | 656 | 34.18% | 615 | 32.05% |
| 1916 | 1,682 | 42.38% | 1,937 | 48.80% | 350 | 8.82% |
| 1920 | 2,352 | 64.97% | 1,075 | 29.70% | 193 | 5.33% |
| 1924 | 1,671 | 51.94% | 828 | 25.74% | 718 | 22.32% |
| 1928 | 2,164 | 67.35% | 1,016 | 31.62% | 33 | 1.03% |
| 1932 | 1,589 | 42.33% | 2,025 | 53.94% | 140 | 3.73% |
| 1936 | 1,385 | 31.41% | 2,630 | 59.64% | 395 | 8.96% |
| 1940 | 2,929 | 49.40% | 2,958 | 49.89% | 42 | 0.71% |
| 1944 | 2,797 | 55.08% | 2,234 | 43.99% | 47 | 0.93% |
| 1948 | 3,265 | 55.36% | 2,499 | 42.37% | 134 | 2.27% |
| 1952 | 5,414 | 70.45% | 2,245 | 29.21% | 26 | 0.34% |
| 1956 | 4,981 | 61.25% | 3,151 | 38.75% | 0 | 0.00% |
| 1960 | 5,043 | 59.86% | 3,381 | 40.14% | 0 | 0.00% |
| 1964 | 4,177 | 52.32% | 3,798 | 47.58% | 8 | 0.10% |
| 1968 | 5,447 | 65.16% | 2,021 | 24.17% | 892 | 10.67% |
| 1972 | 5,908 | 67.36% | 1,870 | 21.32% | 993 | 11.32% |
| 1976 | 5,682 | 59.13% | 3,507 | 36.49% | 421 | 4.38% |
| 1980 | 7,705 | 67.80% | 2,937 | 25.84% | 722 | 6.35% |
| 1984 | 8,441 | 76.24% | 2,611 | 23.58% | 19 | 0.17% |
| 1988 | 6,285 | 66.56% | 2,965 | 31.40% | 193 | 2.04% |
| 1992 | 5,374 | 50.40% | 2,539 | 23.81% | 2,750 | 25.79% |
| 1996 | 6,045 | 61.11% | 2,827 | 28.58% | 1,020 | 10.31% |
| 2000 | 7,624 | 73.28% | 2,336 | 22.45% | 444 | 4.27% |
| 2004 | 8,123 | 74.89% | 2,577 | 23.76% | 146 | 1.35% |
| 2008 | 7,157 | 68.60% | 2,949 | 28.27% | 327 | 3.13% |
| 2012 | 6,851 | 68.81% | 2,759 | 27.71% | 346 | 3.48% |
| 2016 | 7,194 | 68.94% | 2,246 | 21.52% | 995 | 9.54% |
| 2020 | 8,187 | 69.36% | 3,260 | 27.62% | 357 | 3.02% |
| 2024 | 7,710 | 70.44% | 2,884 | 26.35% | 351 | 3.21% |
Economy
[edit]The county is 94% rangeland, with the Bureau of Land Management controlling 72% of the land. Irrigated fields in the county's northeast corner, known as Western Treasure Valley, are the center of intensive and diversified farming. Malheur County's economy also depends on tourism.
The county's two largest employers are Heinz of Ontario, a potato processor branded as Ore-Ida, and the Snake River Correctional Institution, five miles northwest of Ontario.[32]
Communities
[edit] A sugar beet plant of the Amalgamated Sugar Company in Nyssa
Cities
[edit]- Adrian
- Jordan Valley
- Nyssa
- Ontario
- Vale (county seat)
Census-designated places
[edit]Unincorporated communities
[edit]Ghost towns
[edit]Education
[edit]K-12 schools
[edit]School districts include:[40]
- Adrian School District 61
- Annex School District 29
- As of 1998[update] students who graduate from Annex attend Weiser High School, of the Weiser School District, in Weiser, Idaho.[41]
- Arock School District 81
- Burnt River School District 30J
- Harper School District 66
- Huntington School District 16J
- Jordan Valley School District 3
- Juntura School District 12 (elementary only)
- McDermitt School District 51 (a.k.a. Malheur County School District #51) - A district with no employees, it sends all of its students to McDermitt Combined School in McDermitt, Nevada and Oregon, a school operated by the Humboldt County School District.[42]
- Nyssa School District 26
- Ontario School District 8
- Vale School District 84
There is a charter school in Ontario, Four Rivers Community School (4RCC).[43][44]
Private schools, both in Ontario, include:
- Treasure Valley Christian School
- St. Peter Catholic School of the Roman Catholic Diocese of Baker[45]
Eldorado School, the first school in the county, was established in 1869.[46]
Previously Crane Union High School in Harney County served sections of Malheur County.[47] As of 2009[update] Juntura area students could choose from multiple high schools, including Crane, Harper, Ontario High, and Vale High.[48] Formerly there were the Vale Union High School District, Vale Elementary School District, Willowcreek School District, and the Brogan School District, with the latter three being elementary school districts. A referendum was held in 1992, with the unofficial vote count pointing to an approval of the merger of those four districts into a single K-12 school district.[49]
Previously there was a separate Brogan School District 1,[50] and a Rockville School District 2.[51]
Tertiary education
[edit]Treasure Valley Community College is in Ontario.
A portion of the county is in the TVCC district. The remainder is not in any community college district.[52]
Public libraries
[edit]Vale has the Emma Humphrey Library.[53] Ontario Community Library of the Ontario Library District is in Ontario.[54]
See also
[edit]- National Register of Historic Places listings in Malheur County, Oregon
- Malheur Enterprise, local newspaper of public record
References
[edit]- ^ a b "State & County QuickFacts". United States Census Bureau. Retrieved May 17, 2023.
- ^ "Find a County". National Association of Counties. Retrieved June 7, 2011.
- ^ "malheur - traduction". Dictionnaire Français-Anglais [French-English Dictionary] WordReference.com (in English and French). Archived from the original on March 31, 2023. Retrieved December 5, 2024.
- ^ "Malheur County History". Oregon Secretary of State. Archived from the original on November 19, 2017. Retrieved December 5, 2024.
- ^ "2010 Census Gazetteer Files". United States Census Bureau. August 22, 2012. Retrieved February 26, 2015.
- ^ "Celatom Plant Vale, Oregon Location | EP Minerals". epminerals.com. Retrieved March 2, 2023.
- ^ jagtransport (December 22, 2022). "Oregon Eastern Railroad". Jaguar Transport. Retrieved March 2, 2023.
- ^ CARLSON, BRAD (September 28, 2018). "Mountain Time no mystery to Malheur County residents". The Other Oregon. Retrieved June 12, 2024.
- ^ "The Gate city journal. (Nyssa, Or.) 1910-1937, May 11, 1923, Image 1 « Historic Oregon Newspapers". oregonnews.uoregon.edu. Retrieved June 12, 2024.
- ^ "County Population Totals and Components of Change: 2020-2024". United States Census Bureau. Retrieved May 15, 2025.
- ^ "U.S. Decennial Census". United States Census Bureau. Retrieved February 26, 2015.
- ^ "Historical Census Browser". University of Virginia Library. Retrieved February 26, 2015.
- ^ Forstall, Richard L., ed. (March 27, 1995). "Population of Counties by Decennial Census: 1900 to 1990". United States Census Bureau. Retrieved February 26, 2015.
- ^ "Census 2000 PHC-T-4. Ranking Tables for Counties: 1990 and 2000" (PDF). United States Census Bureau. April 2, 2001. Archived from the original (PDF) on February 26, 2015. Retrieved February 26, 2015.
- ^ "1980 Census of Population - General Population Characteristics - Oregon - Table 58 - Persons by Race and Table 59 - Total Persons and Spanish Origin Persons by Type of Spanish Origin and Race (p. 39/24-39/32)" (PDF). United States Census Bureau.
- ^ "1990 Census of Population - General Population Characteristics - Oregon - Table 5 - Race and Hispanic Origin" (PDF). United States Census Bureau. p. 9-30.
- ^ "P004: Hispanic or Latino, and Not Hispanic or Latino by Race – 2000: DEC Summary File 1 – Malheur County, Oregon". United States Census Bureau.
- ^ "P2: Hispanic or Latino, and Not Hispanic or Latino by Race – 2010: DEC Redistricting Data (PL 94-171) – Malheur County, Oregon". United States Census Bureau.
- ^ "P2: Hispanic or Latino, and Not Hispanic or Latino by Race – 2020: DEC Redistricting Data (PL 94-171) – Malheur County, Oregon". United States Census Bureau.
- ^ included in the Asian category in the 1980 Census
- ^ included in the Asian category in the 1990 Census
- ^ not an option in the 1980 Census
- ^ not an option in the 1990 Census
- ^ "2020 Decennial Census Demographic and Housing Characteristics (DHC)". United States Census Bureau. 2023. Retrieved 10 December 2025.
- ^ a b c "2020 Decennial Census Demographic Profile (DP1)". United States Census Bureau. 2021. Retrieved 10 December 2025.
- ^ a b "2020 Decennial Census Redistricting Data (Public Law 94-171)". United States Census Bureau. 2021. Retrieved 10 December 2025.
- ^ a b c "DP-1 Profile of General Population and Housing Characteristics: 2010 Demographic Profile Data". United States Census Bureau. Archived from the original on February 13, 2020. Retrieved February 23, 2016.
- ^ "Population, Housing Units, Area, and Density: 2010 - County". United States Census Bureau. Archived from the original on February 13, 2020. Retrieved February 23, 2016.
- ^ "DP02 SELECTED SOCIAL CHARACTERISTICS IN THE UNITED STATES – 2006-2010 American Community Survey 5-Year Estimates". United States Census Bureau. Archived from the original on February 13, 2020. Retrieved February 23, 2016.
- ^ "DP03 SELECTED ECONOMIC CHARACTERISTICS – 2006-2010 American Community Survey 5-Year Estimates". United States Census Bureau. Archived from the original on February 13, 2020. Retrieved February 23, 2016.
- ^ "U.S. Census Data". census.gov. Archived from the original on September 23, 2015. Retrieved September 23, 2015.
- ^ a b Jacklet, Ben (April 2008). "Prisontown myth". Oregon Business magazine. Archived from the original on December 2, 2008. Retrieved March 25, 2008.
- ^ "Content Manager WebDrawer - 2009 March Voter Registration". records.sos.state.or.us. Retrieved April 21, 2009.
- ^ "Election Results - November 4, 2008 General Election | Malheur County". Archived from the original on August 4, 2012. Retrieved April 21, 2009. Retrieved on April 21, 2009
- ^ "Malheur County, Oregon detailed profile - houses, real estate, cost of living, wages, work, agriculture, ancestries, and more". www.city-data.com. Retrieved April 21, 2009.
- ^ David Leip's Presidential Atlas (Maps for Oregon by election)
- ^ Geographie Electorale
- ^ The New York Times electoral map (Zoom in on Oregon)
- ^ Leip, David. "Dave Leip's Atlas of U.S. Presidential Elections". uselectionatlas.org. Retrieved April 11, 2018.
- ^ Geography Division (December 18, 2020). 2020 Census - School District Reference Map: Malheur County, OR (PDF) (Map). United States Census Bureau. Archived (PDF) from the original on October 9, 2022. Retrieved July 15, 2022. - Text list
- ^ "Home". Annex School District. February 24, 1999. Archived from the original on February 24, 1999. Retrieved July 17, 2022.
- ^ "McDermitt". Vale, Oregon: Malheur Education Service District. Retrieved July 15, 2022. - Linked from "Schools We Serve"
- ^ "Schools We Serve". Malheur Education Service District. Retrieved July 15, 2022.
- ^ "Our History". Four Rivers Community School. Retrieved July 15, 2022.
- ^ "Contact". St. Peter Catholic School. February 9, 2013. Retrieved July 16, 2022. 98 Southwest 9th Street Ontario, OR 97914
- ^ "Malheur County Schools In History". Malheur County. Archived from the original on March 14, 2002. Retrieved March 11, 2024.
- ^ "Head 'em up, Move 'em out, Board 'em". Farm Journal. February 1998. Archived from the original on October 10, 2006. Retrieved July 15, 2022.
- ^ "The Oasis lives between Vale and Burns". East Oregonian. July 25, 2009. Retrieved March 22, 2025.
- ^ Graves, Bill (September 16, 1992). "Centennial residents back bonds". The Oregonian. p. D4 – via Newspapers.com.
- ^ Oregon school directory 1975/76. Oregon State Superintendent of Education. p. 129/308 – via HathiTrust.
- ^ Oregon school directory 1975/76. Oregon State Superintendent of Education. p. 131/308 – via HathiTrust.
- ^ "Oregon Community Colleges and Community College Districts" (PDF). Oregon Department of Community Colleges & Workforce Development. Archived (PDF) from the original on October 9, 2022. Retrieved July 17, 2022.
- ^ "Emma Humphrey Library". City of Vale. Retrieved July 16, 2022. Emma Humphrey Library Address: 150 A St E Vale, OR 97918
- ^ "Home". Ontario Library District. Retrieved July 16, 2022. 388 S.W. 2nd Avenue Ontario, Oregon USA 97914
External links
[edit]- Malheur County (official website)
- Information about Malheur County from Oregon State University Malheur Experiment Station
Municipalities and communities of Malheur County, Oregon, United States | ||
|---|---|---|
| Cities | 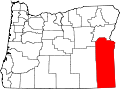 Malheur County map Malheur County map | |
| CDPs | ||
| Other communities | ||
| Ghost towns | ||
| Indian reservation | ||
| Footnotes | ‡This populated place also has portions in an adjacent county or counties | |
| International | |
|---|---|
| National | |
| Other | |